DiskCache DjangoCache Benchmarks
DiskCache provides a Django-compatible cache API in
diskcache.DjangoCache. A discussion of its options and abilities are
described in the tutorial. Here we try to assess its
performance compared to other Django cache backends.
Keys and Values
A survey of repositories on Github showed a diversity of cached values. Among those observed values were:
Processed text, most commonly HTML. The average HTML page size in 2014 was 59KB. Javascript assets totalled an average of 295KB and images range dramatically but averaged 1.2MB.
QuerySets, the building blocks of the Django ORM.
Numbers, settings, and labels. Generally small values that vary in how often they change.
The diversity of cached values presents unique challenges. Below, keys and values, are constrained simply to short byte strings. This is done to filter out overhead from pickling, etc. from the benchmarks.
Backends
Django ships with four cache backends: Memcached, Database, Filesystem, and Local-memory. The Memcached backend uses the PyLibMC client backend. Included in the results below is also Redis provided by the django-redis project built atop redis-py.
Not included were four projects which were difficult to setup and so impractical for testing.
- uWSGI cache backend.
- Amazon S3 backend.
- MongoDB cache backend.
- Cacheops - incompatible filebased caching.
Other caching related projects worth mentioning:
- Request-specific in-memory cache.
- Cacheback moves all cache store operations to background Celery tasks.
- Newcache claims to improve Django’s Memcached backend.
- Supports tagging cache entries.
There are also Django packages which automatically cache database queries by patching the ORM. Cachalot has a good comparison and discussion in its introduction.
Filebased
Django’s filesystem cache backend has a severe drawback. Every set operation
checks whether a cull operation is necessary. This check requires listing all
the files in the directory. To do so a call to glob.glob1 is made. As the
directory size increases, the call slows linearly.
Timings for glob.glob1 |
|
|---|---|
Count |
Time |
1 |
1.602ms |
10 |
2.213ms |
100 |
8.946ms |
1000 |
65.869ms |
10000 |
604.972ms |
100000 |
6.450s |
Above, the count regards the number of files in the directory and the time is the duration of the function call. At only a hundred files, it takes more than five milliseconds to construct the list of files.
Concurrent Access
The concurrent access workload starts eight worker processes each with
different and interleaved operations. None of these benchmarks saturated all
the processors. Operations used 1,100 unique keys and, where applicable, caches
were limited to 1,000 keys. This was done to illustrate the impact of the
culling strategy in locmem and filebased caches.
Get
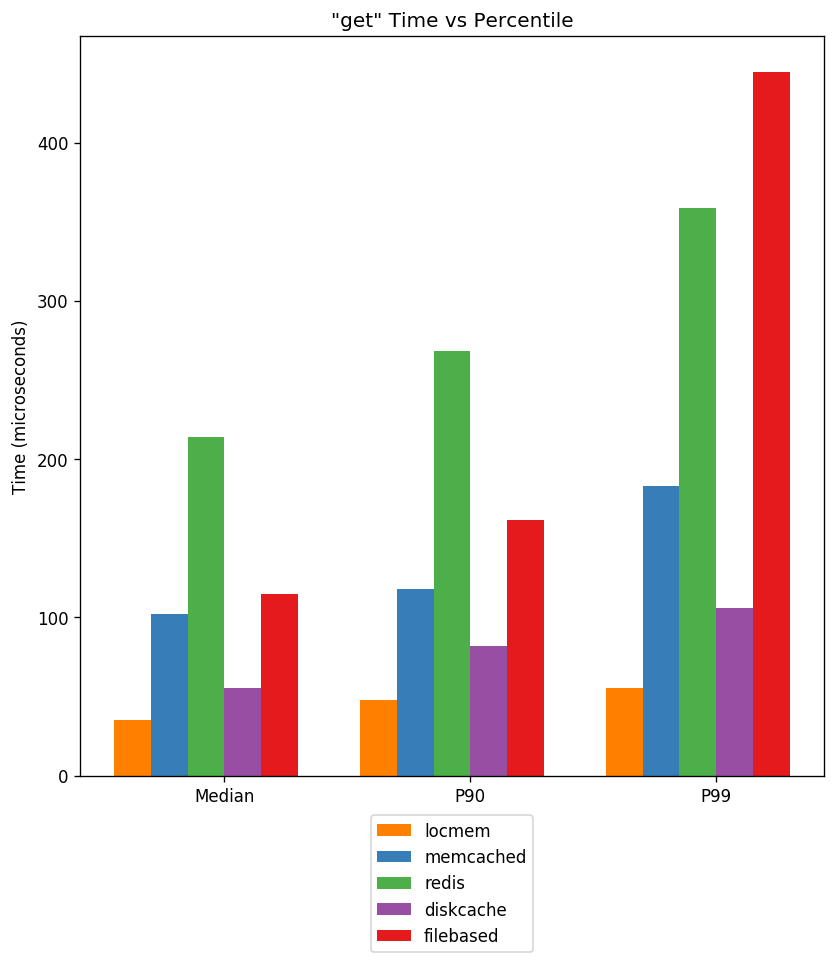
Under heavy load, DjangoCache gets are low
latency. At the 99th percentile they are on par with the Memcached cache
backend.
Set
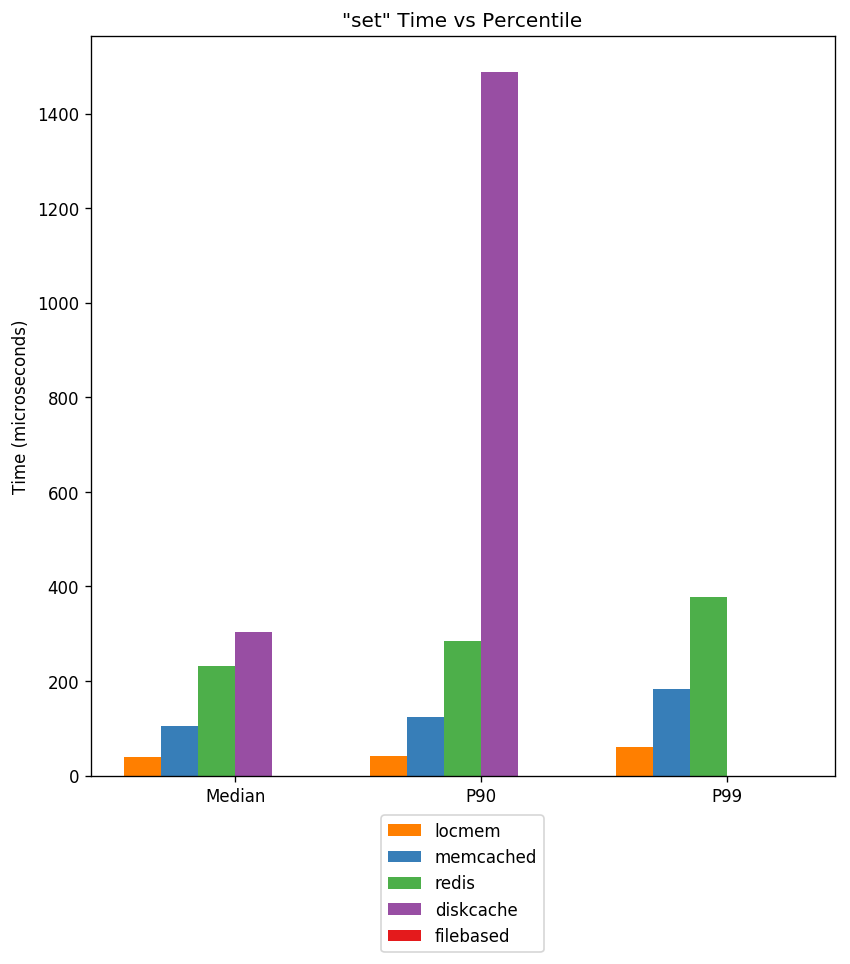
Not displayed above is the filebased cache backend. At all percentiles, the latency exceeded five milliseconds. Timing data is available below. Though DiskCache is the slowest, its latency remains competitive.
Delete
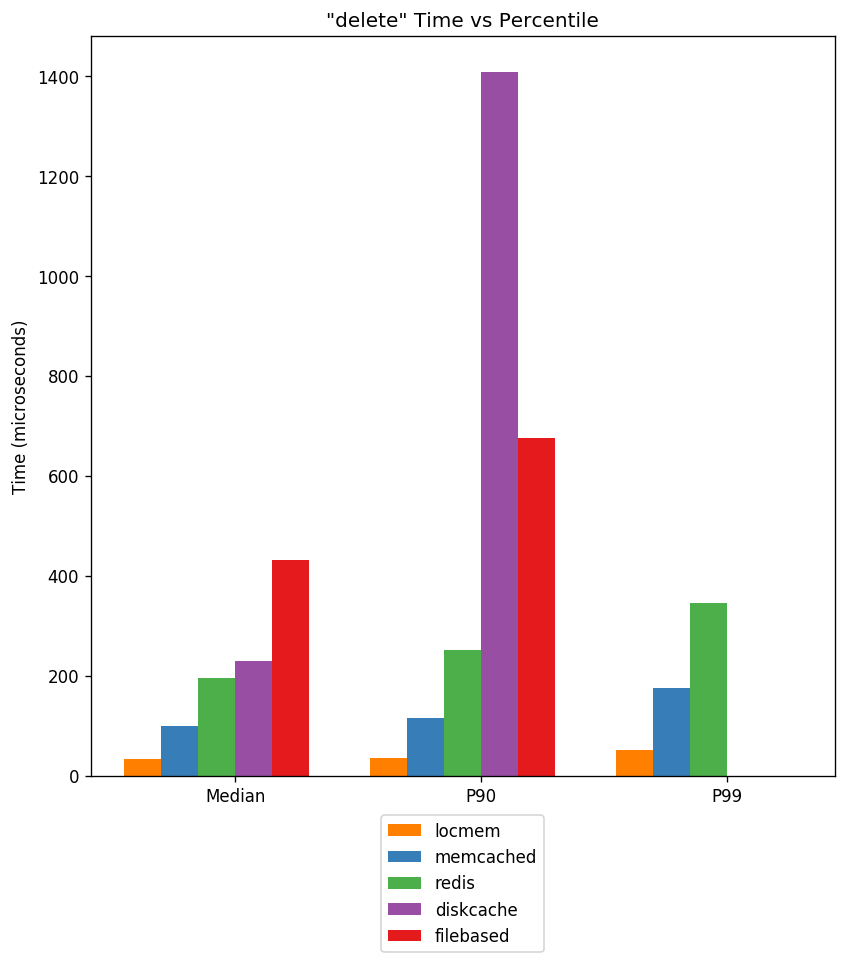
Like sets, deletes require writes to disk. Though DjangoCache is the slowest, it remains competitive with latency
less than five milliseconds. Remember that unlike Local-memory, Memached, and
Redis, it persists all cached data.
Timing Data
Not all data is easily displayed in the graphs above. Miss rate, maximum latency and total latency is recorded below.
Timings for locmem |
|||||||
|---|---|---|---|---|---|---|---|
Action |
Count |
Miss |
Median |
P90 |
P99 |
Max |
Total |
get |
712546 |
140750 |
36.001us |
57.936us |
60.081us |
10.202ms |
28.962s |
set |
71530 |
0 |
36.955us |
39.101us |
45.061us |
2.784ms |
2.709s |
delete |
7916 |
0 |
32.902us |
35.048us |
37.193us |
1.524ms |
265.399ms |
Total |
791992 |
31.936s |
|||||
Notice the high cache miss rate. This reflects the isolation of local memory caches from each other. Also the culling strategy of local memory caches is random.
Timings for memcached |
|||||||
|---|---|---|---|---|---|---|---|
Action |
Count |
Miss |
Median |
P90 |
P99 |
Max |
Total |
get |
712546 |
69185 |
87.023us |
99.182us |
110.865us |
576.973us |
61.758s |
set |
71530 |
0 |
89.169us |
102.043us |
114.202us |
259.876us |
6.395s |
delete |
7916 |
0 |
85.115us |
97.990us |
108.957us |
201.941us |
672.212ms |
Total |
791992 |
68.825s |
|||||
Memcached performance is low latency and stable.
Timings for redis |
|||||||
|---|---|---|---|---|---|---|---|
Action |
Count |
Miss |
Median |
P90 |
P99 |
Max |
Total |
get |
712546 |
69526 |
160.933us |
195.980us |
239.134us |
1.365ms |
116.816s |
set |
71530 |
0 |
166.178us |
200.987us |
242.949us |
587.940us |
12.143s |
delete |
7916 |
791 |
143.051us |
177.860us |
217.915us |
330.925us |
1.165s |
Total |
791992 |
130.124s |
|||||
Redis performance is roughly half that of Memcached. Beware the impact of persistence settings on your Redis performance. Depending on your use of logging and snapshotting, maximum latency may increase significantly.
Timings for diskcache |
|||||||
|---|---|---|---|---|---|---|---|
Action |
Count |
Miss |
Median |
P90 |
P99 |
Max |
Total |
get |
712546 |
69509 |
33.855us |
56.982us |
79.155us |
11.908ms |
30.078s |
set |
71530 |
0 |
178.814us |
1.355ms |
5.032ms |
26.620ms |
34.461s |
delete |
7916 |
0 |
107.050us |
1.280ms |
4.738ms |
17.217ms |
3.303s |
Total |
791992 |
67.842s |
|||||
DjangoCache defaults to using eight shards
with a 10 millisecond timeout. Notice that cache get operations are in
aggregate more than twice as fast as Memcached. And total cache time for all
operations is comparable. The higher set and delete latencies are due to the
retry behavior of DjangoCache objects. If
lower latency is required then the retry behavior can be disabled.
Timings for filebased |
|||||||
|---|---|---|---|---|---|---|---|
Action |
Count |
Miss |
Median |
P90 |
P99 |
Max |
Total |
get |
712749 |
103843 |
112.772us |
193.119us |
423.908us |
18.428ms |
92.428s |
set |
71431 |
0 |
8.893ms |
11.742ms |
14.790ms |
44.201ms |
646.879s |
delete |
7812 |
0 |
223.875us |
389.099us |
679.016us |
15.058ms |
1.940s |
Total |
791992 |
741.247s |
|||||
Notice the higher cache miss rate. That’s a result of the cache’s random
culling strategy. Get and set operations also take three to twenty times longer
in aggregate as compared with DjangoCache.