DiskCache Cache Benchmarks
Accurately measuring performance is a difficult task. The benchmarks on this page are synthetic in the sense that they were designed to stress getting, setting, and deleting items repeatedly. Measurements in production systems are much harder to reproduce reliably. So take the following data with a grain of salt. A stated feature of DiskCache is performance so we would be remiss not to produce this page with comparisons.
The source for all benchmarks can be found under the “tests” directory in the source code repository. Measurements are reported by percentile: median, 90th percentile, 99th percentile, and maximum along with total time and miss rate. The average is not reported as its less useful in response-time scenarios. Each process in the benchmark executes 100,000 operations with ten times as many sets as deletes and ten times as many gets as sets.
Each comparison includes Memcached and Redis with default client and server settings. Note that these backends work differently as they communicate over the localhost network. The also require a server process running and maintained. All keys and values are short byte strings to reduce the network impact.
Single Access
The single access workload starts one worker processes which performs all operations. No concurrent cache access occurs.
Get
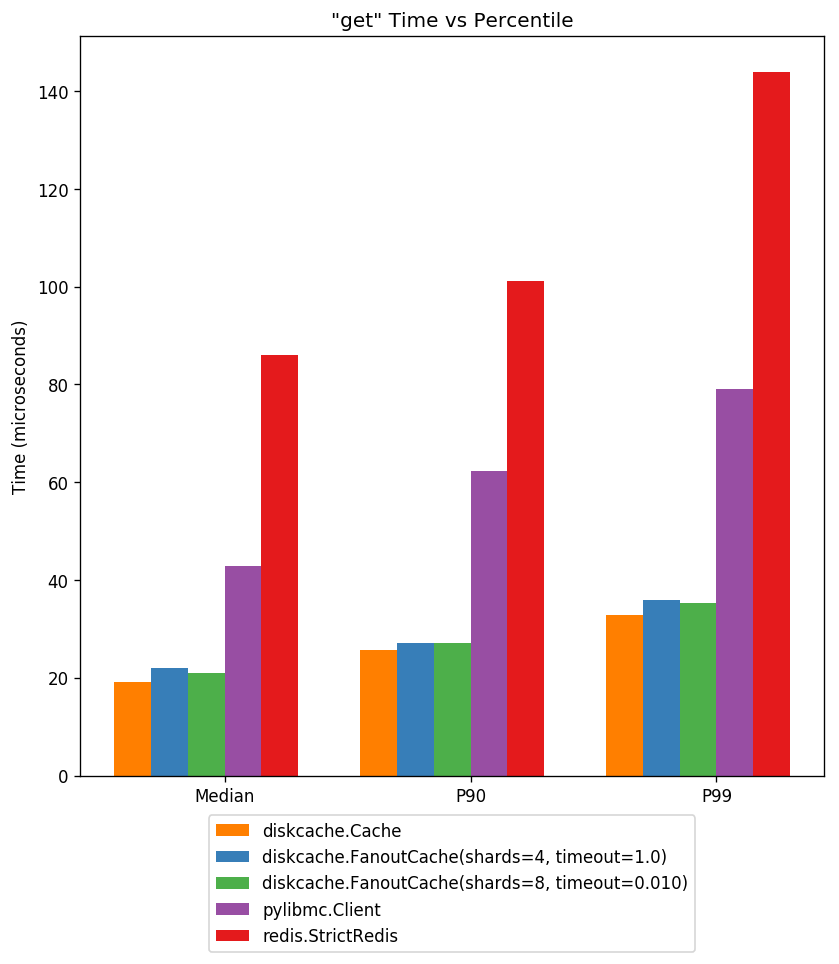
Above displays cache access latency at three percentiles. Notice the performance of DiskCache is faster than highly optimized memory-backed server solutions.
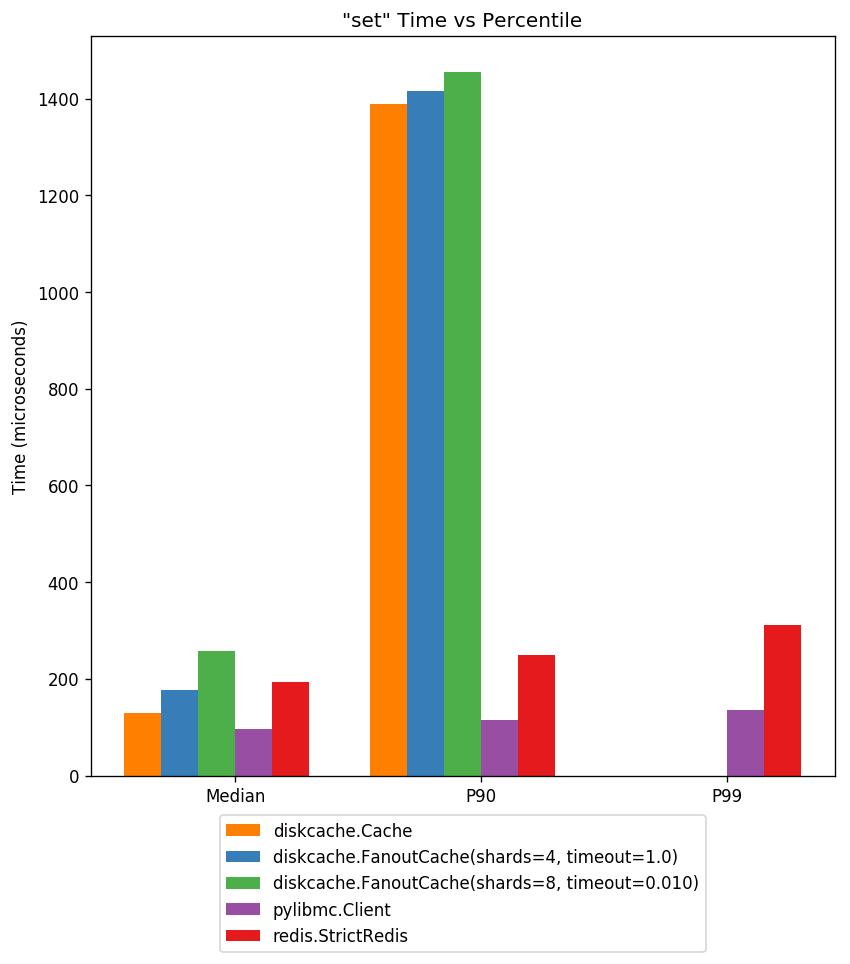
Set
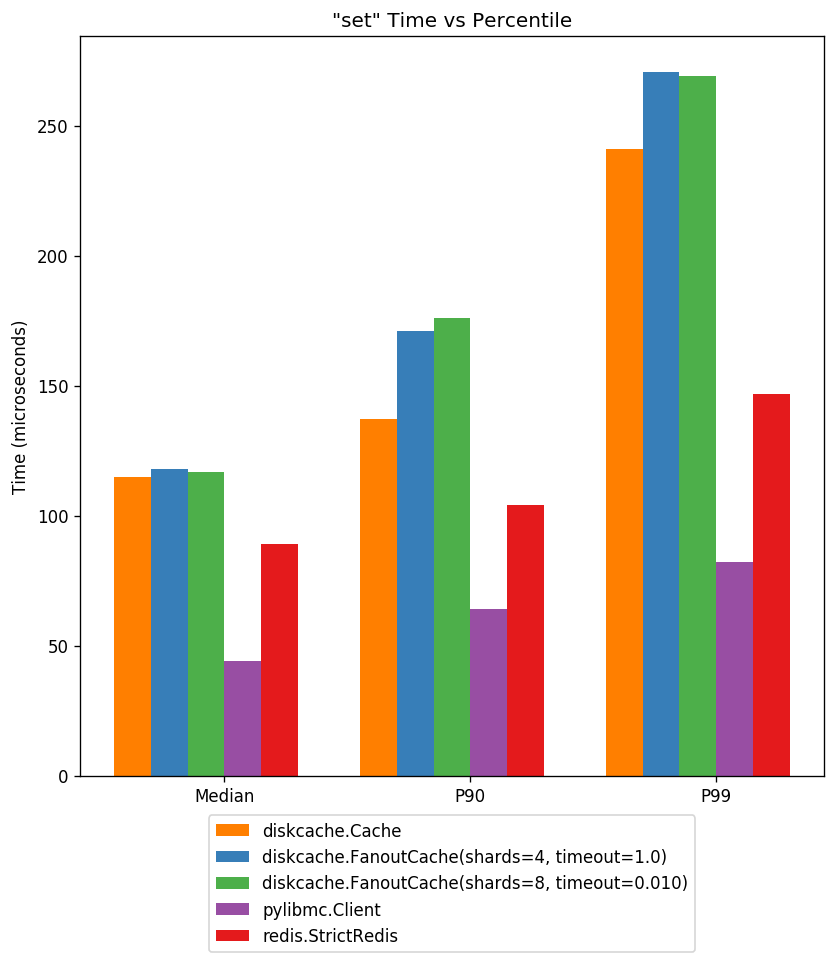
Above displays cache store latency at three percentiles. The cost of writing to disk is higher but still sub-millisecond. All data in DiskCache is persistent.
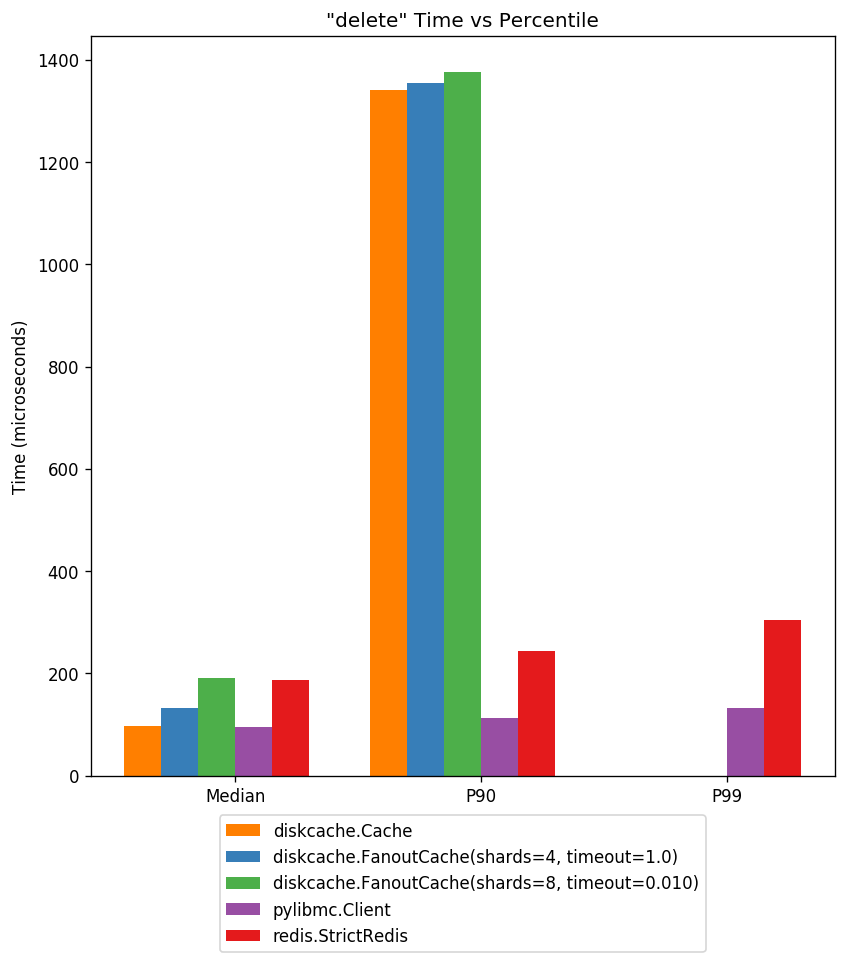
Delete
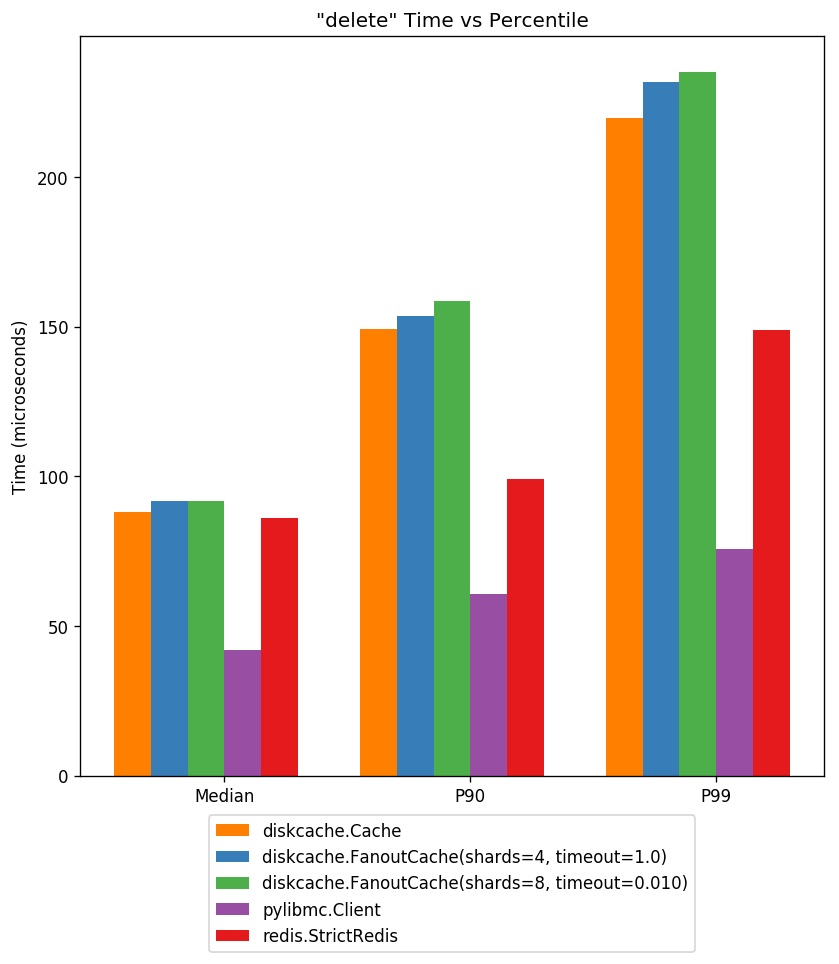
Above displays cache delete latency at three percentiles. As above, deletes require disk writes but latency is still sub-millisecond.
Timing Data
Not all data is easily displayed in the graphs above. Miss rate, maximum latency and total latency is recorded below.
Timings for diskcache.Cache |
|||||||
|---|---|---|---|---|---|---|---|
Action |
Count |
Miss |
Median |
P90 |
P99 |
Max |
Total |
get |
88966 |
9705 |
12.159us |
17.166us |
28.849us |
174.999us |
1.206s |
set |
9021 |
0 |
68.903us |
93.937us |
188.112us |
10.297ms |
875.907ms |
delete |
1012 |
104 |
47.207us |
66.042us |
128.031us |
7.160ms |
89.599ms |
Total |
98999 |
2.171s |
|||||
The generated workload includes a ~1% cache miss rate. All items were stored with no expiry. The miss rate is due entirely to gets after deletes.
Timings for diskcache.FanoutCache(shards=4, timeout=1.0) |
|||||||
|---|---|---|---|---|---|---|---|
Action |
Count |
Miss |
Median |
P90 |
P99 |
Max |
Total |
get |
88966 |
9705 |
15.020us |
20.027us |
33.855us |
437.021us |
1.425s |
set |
9021 |
0 |
71.049us |
100.136us |
203.133us |
9.186ms |
892.262ms |
delete |
1012 |
104 |
48.161us |
69.141us |
129.952us |
5.216ms |
87.294ms |
Total |
98999 |
2.405s |
|||||
The high maximum store latency is likely an artifact of disk/OS interactions.
Timings for diskcache.FanoutCache(shards=8, timeout=0.010) |
|||||||
|---|---|---|---|---|---|---|---|
Action |
Count |
Miss |
Median |
P90 |
P99 |
Max |
Total |
get |
88966 |
9705 |
15.020us |
20.027us |
34.094us |
627.995us |
1.420s |
set |
9021 |
0 |
72.956us |
100.851us |
203.133us |
9.623ms |
927.824ms |
delete |
1012 |
104 |
50.783us |
72.002us |
132.084us |
8.396ms |
78.898ms |
Total |
98999 |
2.426s |
|||||
Notice the low overhead of the FanoutCache. Increasing the number of shards from four to eight
has a negligible impact on performance.
Timings for pylibmc.Client |
|||||||
|---|---|---|---|---|---|---|---|
Action |
Count |
Miss |
Median |
P90 |
P99 |
Max |
Total |
get |
88966 |
9705 |
25.988us |
29.802us |
41.008us |
139.952us |
2.388s |
set |
9021 |
0 |
27.895us |
30.994us |
40.054us |
97.990us |
254.248ms |
delete |
1012 |
104 |
25.988us |
29.087us |
38.147us |
89.169us |
27.159ms |
Total |
98999 |
2.669s |
|||||
Memcached performance is low latency and stable.
Timings for redis.StrictRedis |
|||||||
|---|---|---|---|---|---|---|---|
Action |
Count |
Miss |
Median |
P90 |
P99 |
Max |
Total |
get |
88966 |
9705 |
44.107us |
54.121us |
73.910us |
204.086us |
4.125s |
set |
9021 |
0 |
45.061us |
56.028us |
75.102us |
237.942us |
427.197ms |
delete |
1012 |
104 |
44.107us |
54.836us |
72.002us |
126.839us |
46.771ms |
Total |
98999 |
4.599s |
|||||
Redis performance is roughly half that of Memcached. DiskCache performs better than Redis for get operations through the Max percentile.
Concurrent Access
The concurrent access workload starts eight worker processes each with different and interleaved operations. None of these benchmarks saturated all the processors.
Get
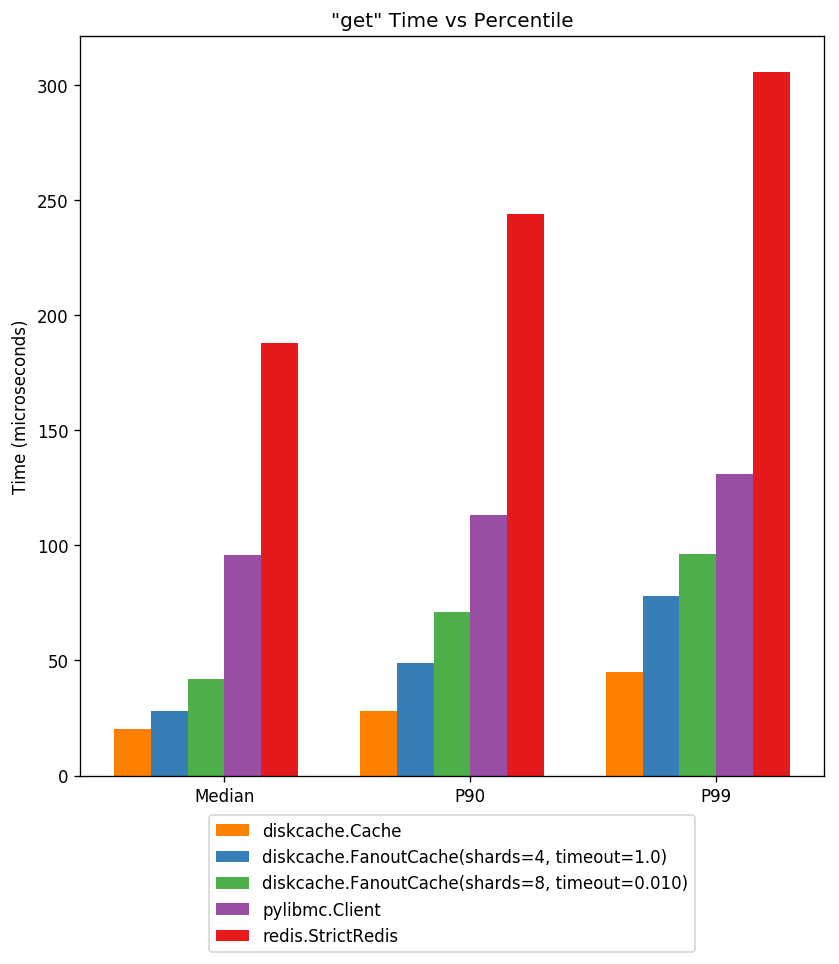
Under heavy load, DiskCache gets are low latency. At the 90th percentile, they are less than half the latency of Memcached.
Set
Stores are much slower under load and benefit greatly from sharding. Not displayed are latencies in excess of five milliseconds. With one shard allocated per worker, latency is within a magnitude of memory-backed server solutions.
Delete
Again deletes require writes to disk. Only the FanoutCache performs well with one shard allocated per worker.
Timing Data
Not all data is easily displayed in the graphs above. Miss rate, maximum latency and total latency is recorded below.
Timings for diskcache.Cache |
|||||||
|---|---|---|---|---|---|---|---|
Action |
Count |
Miss |
Median |
P90 |
P99 |
Max |
Total |
get |
712546 |
71214 |
15.974us |
23.127us |
40.054us |
4.953ms |
12.349s |
set |
71530 |
0 |
94.891us |
1.328ms |
21.307ms |
1.846s |
131.728s |
delete |
7916 |
807 |
65.088us |
1.278ms |
19.610ms |
1.244s |
13.811s |
Total |
791992 |
157.888s |
|||||
Notice the unacceptably high maximum store and delete latency. Without
sharding, cache writers block each other. By default Cache objects raise a timeout error after sixty seconds.
Timings for diskcache.FanoutCache(shards=4, timeout=1.0) |
|||||||
|---|---|---|---|---|---|---|---|
Action |
Count |
Miss |
Median |
P90 |
P99 |
Max |
Total |
get |
712546 |
71623 |
19.073us |
35.048us |
59.843us |
12.980ms |
16.849s |
set |
71530 |
0 |
108.004us |
1.313ms |
9.176ms |
333.361ms |
50.821s |
delete |
7916 |
767 |
73.195us |
1.264ms |
9.033ms |
108.232ms |
4.964s |
Total |
791992 |
72.634s |
|||||
Here FanoutCache uses four shards to
distribute writes. That reduces the maximum latency by a factor of ten. Note
the miss rate is variable due to the interleaved operations of concurrent
workers.
Timings for diskcache.FanoutCache(shards=8, timeout=0.010) |
|||||||
|---|---|---|---|---|---|---|---|
Action |
Count |
Miss |
Median |
P90 |
P99 |
Max |
Total |
get |
712546 |
71106 |
25.034us |
47.922us |
101.089us |
9.015ms |
22.336s |
set |
71530 |
39 |
134.945us |
1.324ms |
5.763ms |
16.027ms |
33.347s |
delete |
7916 |
775 |
88.930us |
1.267ms |
5.017ms |
13.732ms |
3.308s |
Total |
791992 |
58.991s |
|||||
With one shard allocated per worker and a low timeout, the maximum latency is more reasonable and corresponds to the specified 10 millisecond timeout. Some set and delete operations were therefore canceled and recorded as cache misses. The miss rate due to timeout is about 0.01% so our success rate is four-nines or 99.99%.
Timings for pylibmc.Client |
|||||||
|---|---|---|---|---|---|---|---|
Action |
Count |
Miss |
Median |
P90 |
P99 |
Max |
Total |
get |
712546 |
72043 |
83.923us |
107.050us |
123.978us |
617.027us |
61.824s |
set |
71530 |
0 |
84.877us |
108.004us |
124.931us |
312.090us |
6.283s |
delete |
7916 |
796 |
82.970us |
105.858us |
123.024us |
288.963us |
680.970ms |
Total |
791992 |
68.788s |
|||||
Memcached performance is low latency and stable even under heavy load. Notice
that cache gets are three times slower in total as compared with
FanoutCache. The superior performance of get
operations put the overall performance of DiskCache ahead of
Memcached.
Timings for redis.StrictRedis |
|||||||
|---|---|---|---|---|---|---|---|
Action |
Count |
Miss |
Median |
P90 |
P99 |
Max |
Total |
get |
712546 |
72093 |
138.044us |
169.039us |
212.908us |
151.121ms |
101.197s |
set |
71530 |
0 |
138.998us |
169.992us |
216.007us |
1.200ms |
10.173s |
delete |
7916 |
752 |
136.137us |
167.847us |
211.954us |
1.059ms |
1.106s |
Total |
791992 |
112.476s |
|||||
Redis performance is roughly half that of Memcached. Beware the impact of persistence settings on your Redis performance. Depending on your use of logging and snapshotting, maximum latency may increase significantly.